How Elk Grove Improves Services With a Data-Driven Mindset
By Polco on July 8, 2024

How the California city uses data analysis to enhance city operations, improve transparency, and build a brighter future for residents.
The City of Elk Grove places high value on data-driven decision-making. With that mindset, the City launched a Performance Indicator Program to collect data points across departments that paint a picture of Elk Grove's operations and how they impact the community.
With this treasure trove of information, Elk Grove can better understand its performance, make better informed plans, allocate funding more effectively, track their project progress over time, and showcase the City’s efforts to strengthen community relationships.
 "So much hard work is being put into a lot of these programs and policy areas, but that doesn't get communicated out there very often, said Aishwarya (Ash) Kumar, Senior Management Analyst who is leading the Performance Indicator Program.
While data-driven decision-making has many benefits for local governments, pinning down the right indicators is a complex task. Like walking down a crowded pasta sauce aisle, it’s easy to be overwhelmed by choices.

Finding the Right Data Points
To tackle this project, Kumar worked with each department to select indicators that best represent their individual objectives. The department-level indicators also speak to the City's overarching goals.
Kumar and her team prioritized outcome metrics, measurements that demonstrate progress toward their targets and the overall effectiveness of public programs and services. (Governments typically only track outputs, productivity-related measurements.)
To bolster the Performance Indicator Program, Elk Grove pulled in data from other sources as well.
Kumar recently took part in the Data-Driven Decision-Making Certificate Program instructed by Polco in partnership with the International City/County Management Association (ICMA).
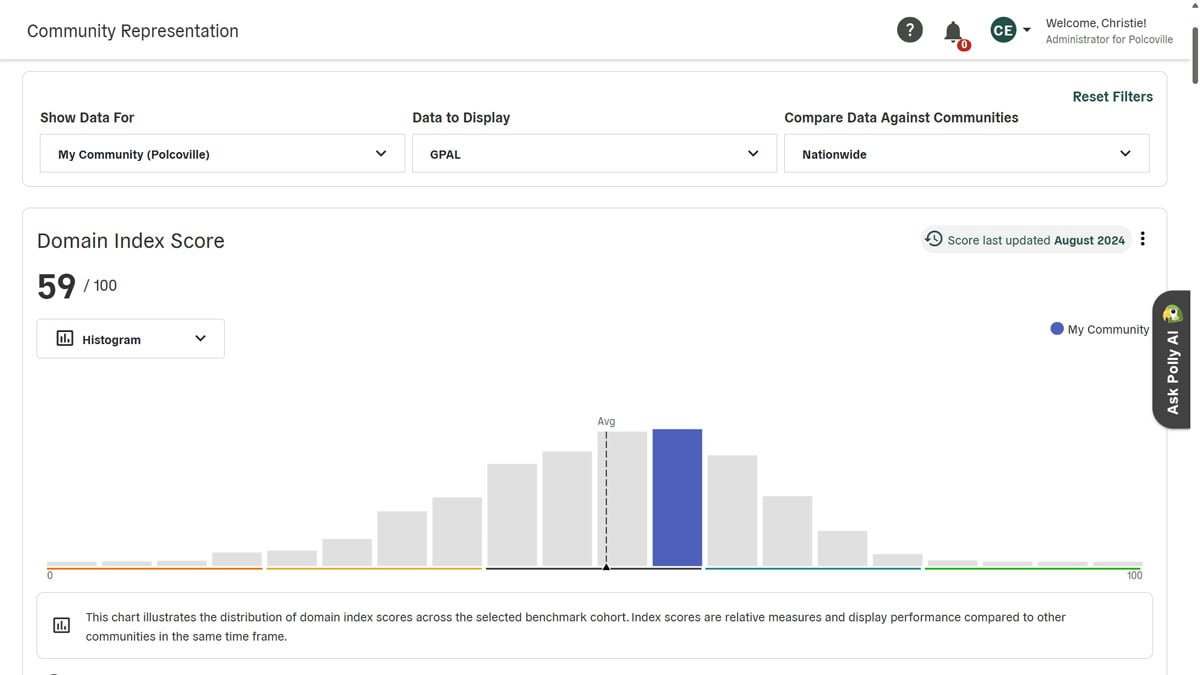
 Here, she discovered Polco’s Government Performance Action and Learning (GPAL) data. GPAL (also known as Track) is a collection of public data points curated by experts to reflect a community’s quality of life. The GPAL data represents ten domains of livability, including everything from housing cost to green space access. The data points come from trusted sources such as the US Census Bureau, the Bureau of Labor Statistics, and dozens more.
"By integrating the GPAL data with our new performance indicators, we can narrate our story more effectively. This approach helps us understand trends and patterns better,” Kumar said.

Example of GPAL data hub dashboard (not Elk Grove's data)
The City is also a long-time user of the The National Community Survey (The NCS) by Polco. This comprehensive assessment measures resident opinion of the quality of life and government services provided in Elk Grove.
Similarly, The NCS data add more color and detail to their other metrics.
“For example, when implementing a master plan or securing a grant, we can analyze The NCS data to better understand trends and patterns. This analysis helps us evaluate the effectiveness of our initiatives,” Kumar said.

Continuing With a Data-Driven Mindset
Kumar is in the process of refining and finalizing the indicators. A major goal of hers is to work with the City’s Information Technology team to put the performance indicators, GPAL, and The NCS results all in one place.
The Performance Indicator Program data will continually guide decisions and plans. Elk Grove can better assess impact of their investments and make informed decisions for future improvements. As a result, Residents can look forward to a more effective government that makes smart choices and shares its progress along the way—all through the lens of data.
Simplify Data Collection With Polco
A data-driven mindset leads to more effective governance. But many organizations lack the time and resources to identify key indicators. With Polco's GPAL data, you get access to meaningful data points about your community instantly.
Popular posts
Sign-up for Updates
You May Also Like
These Related Stories

How Pinellas County Made Strategic Planning Simple

From Chaos to Clarity: Lead with Confidence Using Domain Scores


