By Polco on December 10, 2025

A Track-driven checklist for smarter planning and stronger resident communication
As the calendar turns, city managers face a familiar challenge. There is far more data available than time to sift through it. Track organizes hundreds of metrics into eleven clear domains of community livability. This framework makes it easier for leaders to see what truly matters and where early action will pay off.
Below are five essential indicators, one from five different livability domains, to review before January. For each, you’ll see why the metric matters, how to act on it right away, and how to communicate findings through a concise Polco feed post that builds trust and transparency with residents.
1. Economy
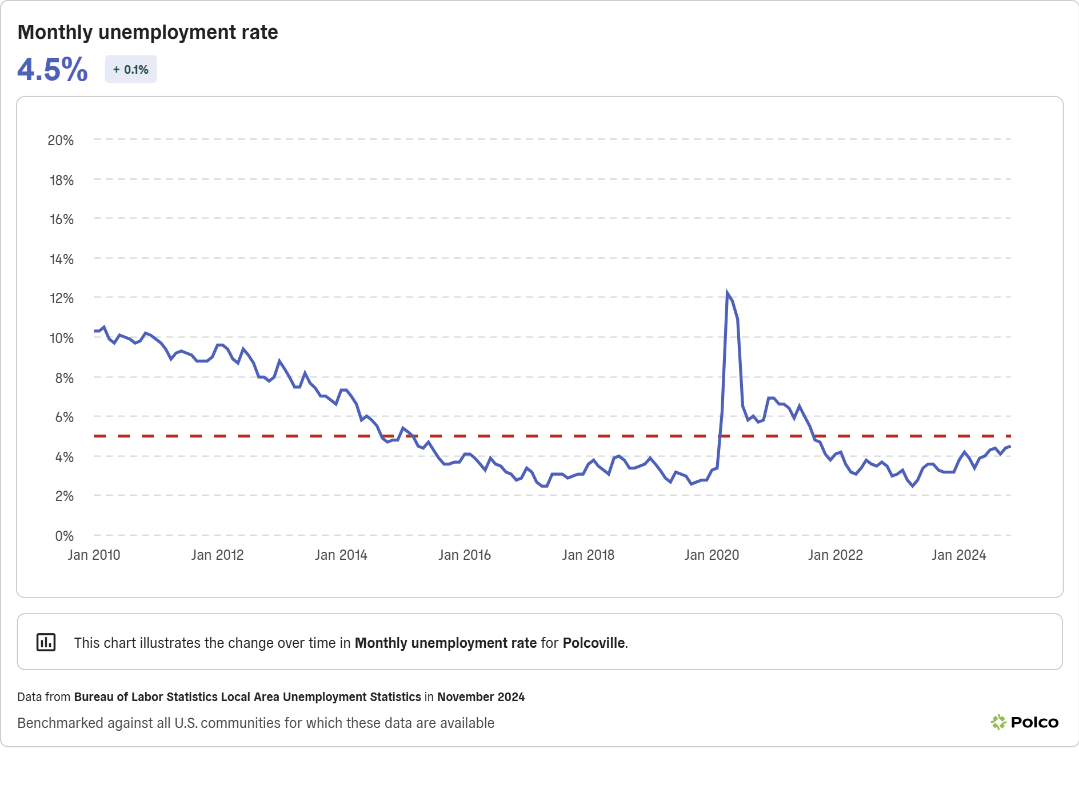
Indicator: Monthly Unemployment Rate
Why it matters
Unemployment is one of the clearest signals of economic stability. Track’s economy indicators help leaders understand workforce health, income distribution, and community resilience. Rising unemployment can indicate emerging stress in local industries or skills mismatches.
How to act on it in January
- Convene an early-year check-in with economic development partners.
- Review which sectors are driving the change and identify training or employer support opportunities.
- If unemployment is declining, highlight success and look for ways to sustain momentum.
How to communicate it on Polco
“New year check-in. Track data shows our unemployment rate at X percent. We’re reviewing local industry trends and meeting with workforce partners to support job stability. What industries do you feel need the most attention in 2025? Share your thoughts below.”
(Include a simple Track visualization or short explanation. Residents are accustomed to seeing data in feed posts.)
2. Safety
Indicator: Perceptions of Safety from the National Community Survey
Why it matters
Safety perceptions shape residents' daily experience more than raw incident counts. A community can have low crime yet still experience low trust or high fear, limiting mobility and public space use.
How to act on it in January
- Compare sentiment to objective crime statistics to identify gaps.
- Host a briefing with police leadership to align messaging and priorities.
- Plan early-year community policing or public education campaigns if perceptions lag reality.
How to communicate it on Polco
“Our latest data shows how safe residents feel in our community. This reflects both public safety services and broader community experiences. We’re reviewing the numbers with our police department and planning outreach for the year. What helps you feel safer where you live?”
3. Housing
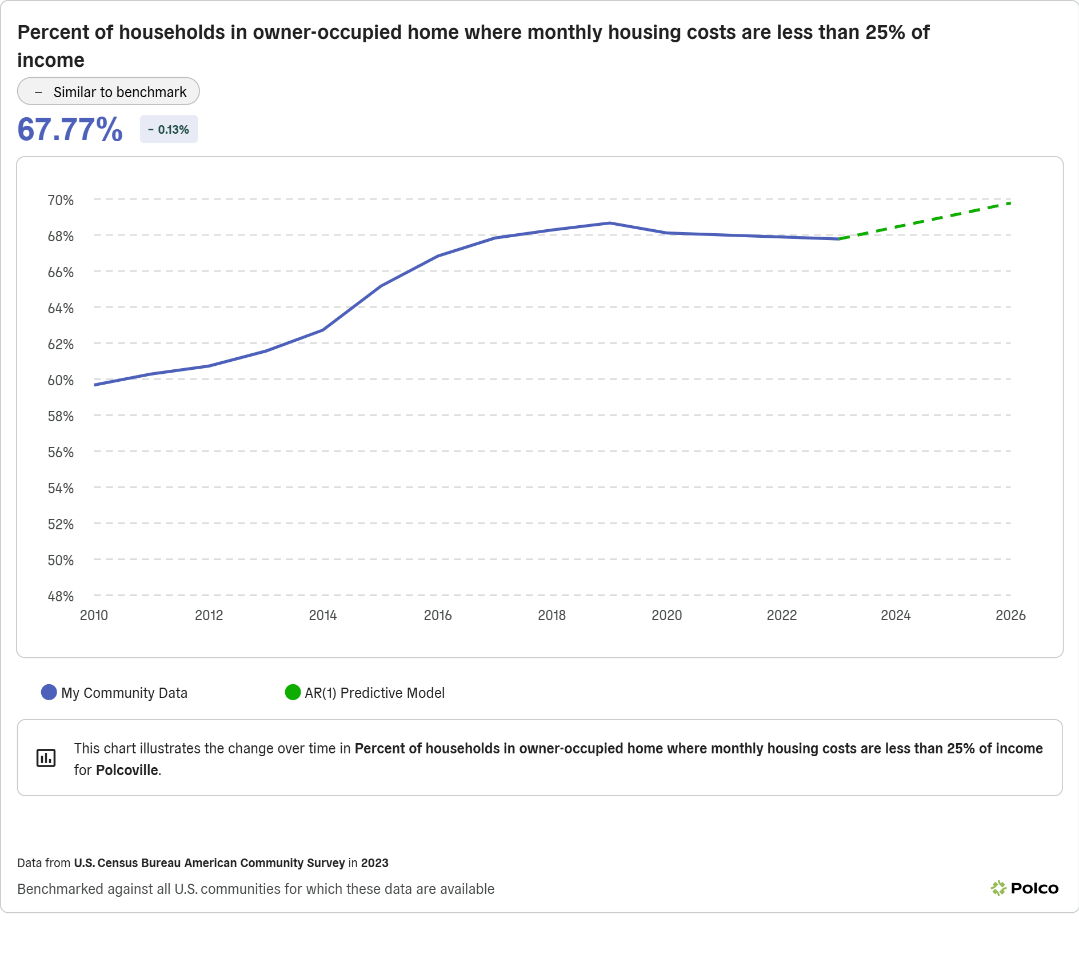
Indicator: Percent of Cost-Burdened Households
Why it matters
Cost burden is a primary signal of housing stress. When more than 30 percent of a household’s income goes to housing, families have less capacity for transportation, healthcare, and savings. Tracking this metric early in the year helps leaders anticipate zoning adjustments, development incentives, or rental-assistance considerations.
How to act on it in January
- Map where cost burden is highest and review zoning or transit access in those areas.
- Meet with planning staff to review upcoming permit pipelines.
- Prepare a summary for council retreat or budget kickoff discussions.
How to communicate it on Polco
“Housing affordability remains a top priority. Track data shows X percent of households in our community spend more than 30 percent of income on housing. We’re reviewing what this means for planning and development in 2025. What housing challenges do you see in your neighborhood?”
4. Mobility
Indicator: Average Commute Time
Why it matters
Commute time is a proxy for transportation system health. Longer commutes reduce quality of life and indicate issues in transit coverage, roadway congestion, or jobs-housing balance. This metric is particularly helpful for identifying inequities faced by residents who rely on specific corridors or modes.
How to act on it in January
- Identify population groups with disproportionately long travel times.
- Review upcoming transportation capital projects for alignment with needs.
- Coordinate with regional partners on transit service adjustments.
How to communicate it on Polco
“We’re reviewing mobility trends for the new year. Current commute times average X minutes in our community. We’re using this data to inform transportation planning and service coordination. What would make your daily travel more efficient?”
5. Health & Wellness
Indicator: Percent of Adults with Obesity
Why it matters
Wellness metrics influence long-term healthcare costs, workforce productivity, and quality of life. Obesity rates also correlate with access to parks, healthy food, safe streets, and recreation programs.
How to act on it in January
- Assess the alignment of parks and recreation programs with population health needs.
- Review gaps in access to trails, sidewalks, and active transportation infrastructure.
- Consider partnerships with healthcare providers for community wellness initiatives.
How to communicate it on Polco
“We’re starting the year by reviewing community health data. Track shows X percent of adults in our area live with obesity. We’re working with parks and health partners to strengthen wellness programs. What activities or amenities help you stay healthy?”
Closing the Loop
Using Track Data is only half the work. The other half is communicating findings early and consistently. Polco’s resident feed makes it easy to share brief insights, embed data visualizations, and invite meaningful conversation. Each post builds transparency and strengthens trust as you bring residents along for the policy and planning work ahead.


The 500-Page Budget No One Reads

Two Ways Local Governments Can Build a Culture of Community Engagement