By Polco on May 11, 2018
The primary objective of online engagement is to streamline civic communication in communities by improving how local government officials and residents communicate. Augmenting the status quo by hearing from those they wouldn’t otherwise, getting more thoughtful feedback, or automating sentiment reporting to save city staff time over traditional practices should be the goal, and we hope those pursuing online communications find these to be true. These tools should better current engagement practices, unify digital engagement channels and supplement traditional in-person events.
With that said, as the audience grows larger and more representative, beyond merely providing a tool for more residents to participate, results can also begin to carry statistical significance. Depending on your margin of error tolerances and representativeness needs this could happen with a city's first batch of questions. We’ve seen several cities hit this threshold within days of launching, and while not the norm, should be something you’re prepared to explain.

While we hope any results from online civic engagement add value by bringing more thoughts to the conversation, we also want to provide confidence that these results can be, and often are, statistically sound. Simply because a survey was done online or was less expensive than traditional statistical surveys does not mean its results are less valuable. There are often times that online results are as good, if not better, than traditional analog surveys, and those situations are becoming more frequent as fewer residents answer landline polls or answer knocked doors.
The following guideline provides a helpful starting point on how and when to draw statistical inference from results.
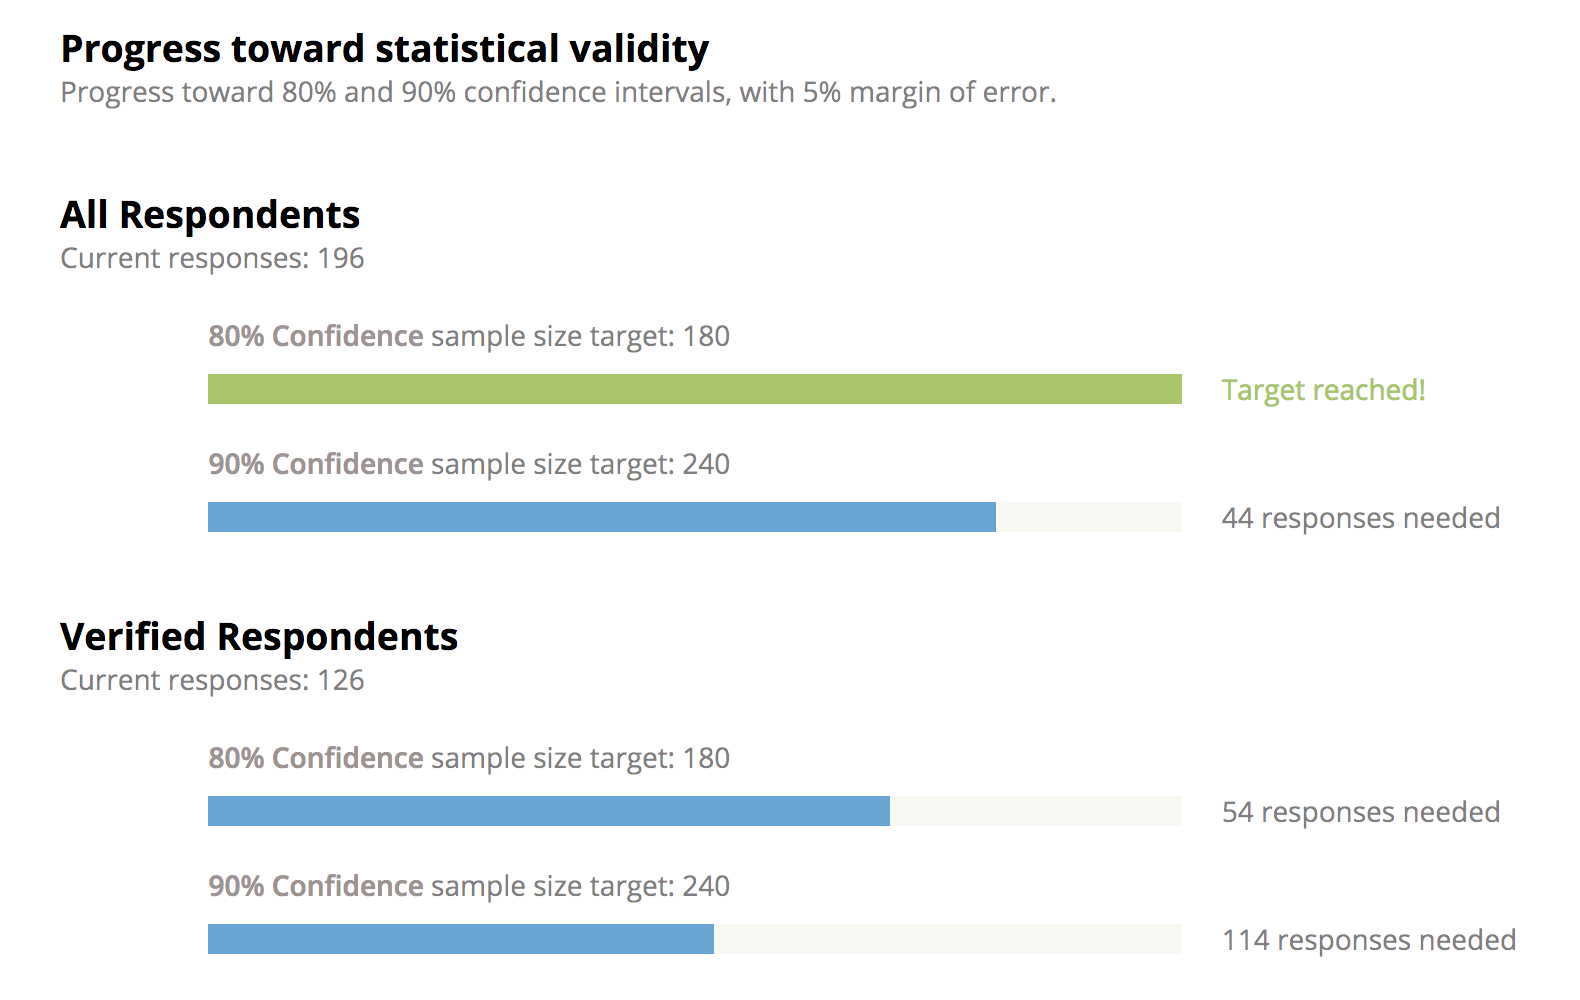
- Assessing the Statistical Significance of a sample. The statistical significance of a sample is not a fixed percentage of population. Instead, the significance scales nonlinearly with population size. For a small city, a significant sample could be 250 respondents. For a city 100x that in population the significant sample could be 3x, or 750 respondents. The proper sample size also depends on the margin of error local officials are willing to tolerate.
- Assessing appropriate Margin of Error and Confidence tolerances. How much margin of error a city official should be willing to tolerate in order to cite results depends on perceived or expected variation in sentiment. If a survey is 80% to 20% with a fair amount of results reported, then a city official can tolerate a higher margin of error and be relatively confident that the majority favors the position. A 10% margin of error should be sufficient in this case, and hence a smaller sample size is sufficient to comprise a statistically significant result for the city. If a survey is 51% to 49% with a fair amount of results reported, then we should have a much tighter margin of error tolerance before confidently concluding that a majority favors one position. A smaller margin of error needs a bigger sample size to cite the results confidently.
- Assessing the Representativeness of the sample. Depending on the question at hand or the results a city official might want to cite, beyond just the sample size, the representativeness of a sample is also often important. The appropriate way to do this is to decide which demographic or geographic breakdowns are important to check representation for. A city may want to check by age deciles, by district, by gender, or by other subsets. A point of caution is that given the nonlinear relationship between statistically significant sample size and population it can be very difficult, for any survey or polling method, to generate a statistically significant sample for every subset, and even harder for all combinations (middle-aged females in District 2, for example). This makes choosing which dimensions to seek representativeness important. On Polco, results and representativeness are viewable (and therefore assessable) in real time. This means outreach can be adjusted to ensure the right people are participating real time, and our team has resources and information on real-time outreach adjustment.
- Assessing Selection Bias and Comparing polling methodologies. Two primary methods of surveying (or polling) exist and an understanding of their tradeoffs is helpful. Polco, for example, falls into the second method
- Method 1: Probability Polling: Surveyor draws a random representative sample from the population, usually registered voters of an area. Then the surveyors survey the sample via the means they have to find these individuals: most commonly via landline phone calls, pre-arranged focus groups, or knocking doors.
- Pros & Cons: Traditional and tested. Suffers selection bias on who has landlines and answers landline calls or knocked doors. This bias is increasing in time. Expensive. Slow. Limited meta-data insights.
- Pros & Cons: Traditional and tested. Suffers selection bias on who has landlines and answers landline calls or knocked doors. This bias is increasing in time. Expensive. Slow. Limited meta-data insights.
- Method 2: Non Probability Polling: Surveyor casts a wide net to collect sentiment from as many respondents as possible, creating a large sample, typically online. The surveyor conducts appropriate re-weighting and/or sub-sampling to account for differences between sample demographics and known population demographics.
- Pros & Cons: Newer. Can suffer less selection bias, and the amount of selection bias from who’s online decreases every year. Currently ~80% of US adults are on social media, with a higher percentage having online access. Faster, less expensive. Also yields insights on social mapping of information flows and network effects on preference formation.
- Method 1: Probability Polling: Surveyor draws a random representative sample from the population, usually registered voters of an area. Then the surveyors survey the sample via the means they have to find these individuals: most commonly via landline phone calls, pre-arranged focus groups, or knocking doors.
Reference
What Makes a Community Survey Statistically Reliable?

How to Interpret Community Survey Results With Confidence