By Polco on October 29, 2024
Halloween is just around the corner, and while kids are busy picking out costumes and plotting their trick-or-treat routes, we’ve been digging into the data to uncover the best cities for candy-filled adventures. Thanks to Polco’s granular data analysis, we've pinpointed the top 7 U.S. cities where trick-or-treating combines the perfect balance of safety, walkability, convenience, and, of course, plenty of candy!
To identify the top trick-or-treating cities, we leveraged Polco's advanced analytic capabilities with the Government Performance Action and Learning (GPAL) nationwide public database (accessible on the Polco Platform). This allows users to examine key community factors with remarkable ease and clarity.
We evaluated factors such as housing density (to ensure homes are close enough for efficient candy stops), crime rates (safety first), walkability (so kids don’t have to hike between houses), and even dental health (because, after all, Halloween candy comes with consequences). After crunching the numbers, here are our top seven cities for trick-or-treating.

City Rankings for Trick-or-Treating
- New Providence, New Jersey
This city offers the perfect combination of walkable neighborhoods, low crime rates, and excellent dental care access. Families here can feel safe and secure as they go door to door, with the added bonus of nearby neighbors—so there is no need for long walks between candy stops. - Bay Harbor Islands, Florida
Located in sunny Florida, Bay Harbor Islands stands out for its dense housing and high walkability. Trick-or-treaters here can safely enjoy an easy stroll through neighborhoods while grabbing treats. - University Park, Texas
Texas makes the cut with University Park, a city that balances walkability with a strong sense of community. Lower crime rates and tightly knit homes make this a prime destination for costumed candy hunters. - Bay Village, Ohio
Bay Village is an excellent choice for families looking for safe and walkable streets. Thanks to its strong dental health statistics and high walkability score, it’s one of the best spots for trick-or-treating in Ohio. - Vienna, Virginia
A strong showing from Virginia, Vienna boasts low crime rates and high walkability, ensuring families can trick-or-treat with peace of mind. Residents take pride in their well-maintained, close-knit neighborhoods. - Leonia, New Jersey
Leonia earns New Jersey its second spot on the list. The town's balance of safety and walkability makes it a Halloween favorite. Plus, with great dental care access, it’s no wonder this community takes trick-or-treating seriously! - Buffalo Grove, Illinois
Buffalo Grove rounds out the list, where close housing, safe streets, and great walkability create the perfect environment for Halloween night.
What Did the Data Tell Us?
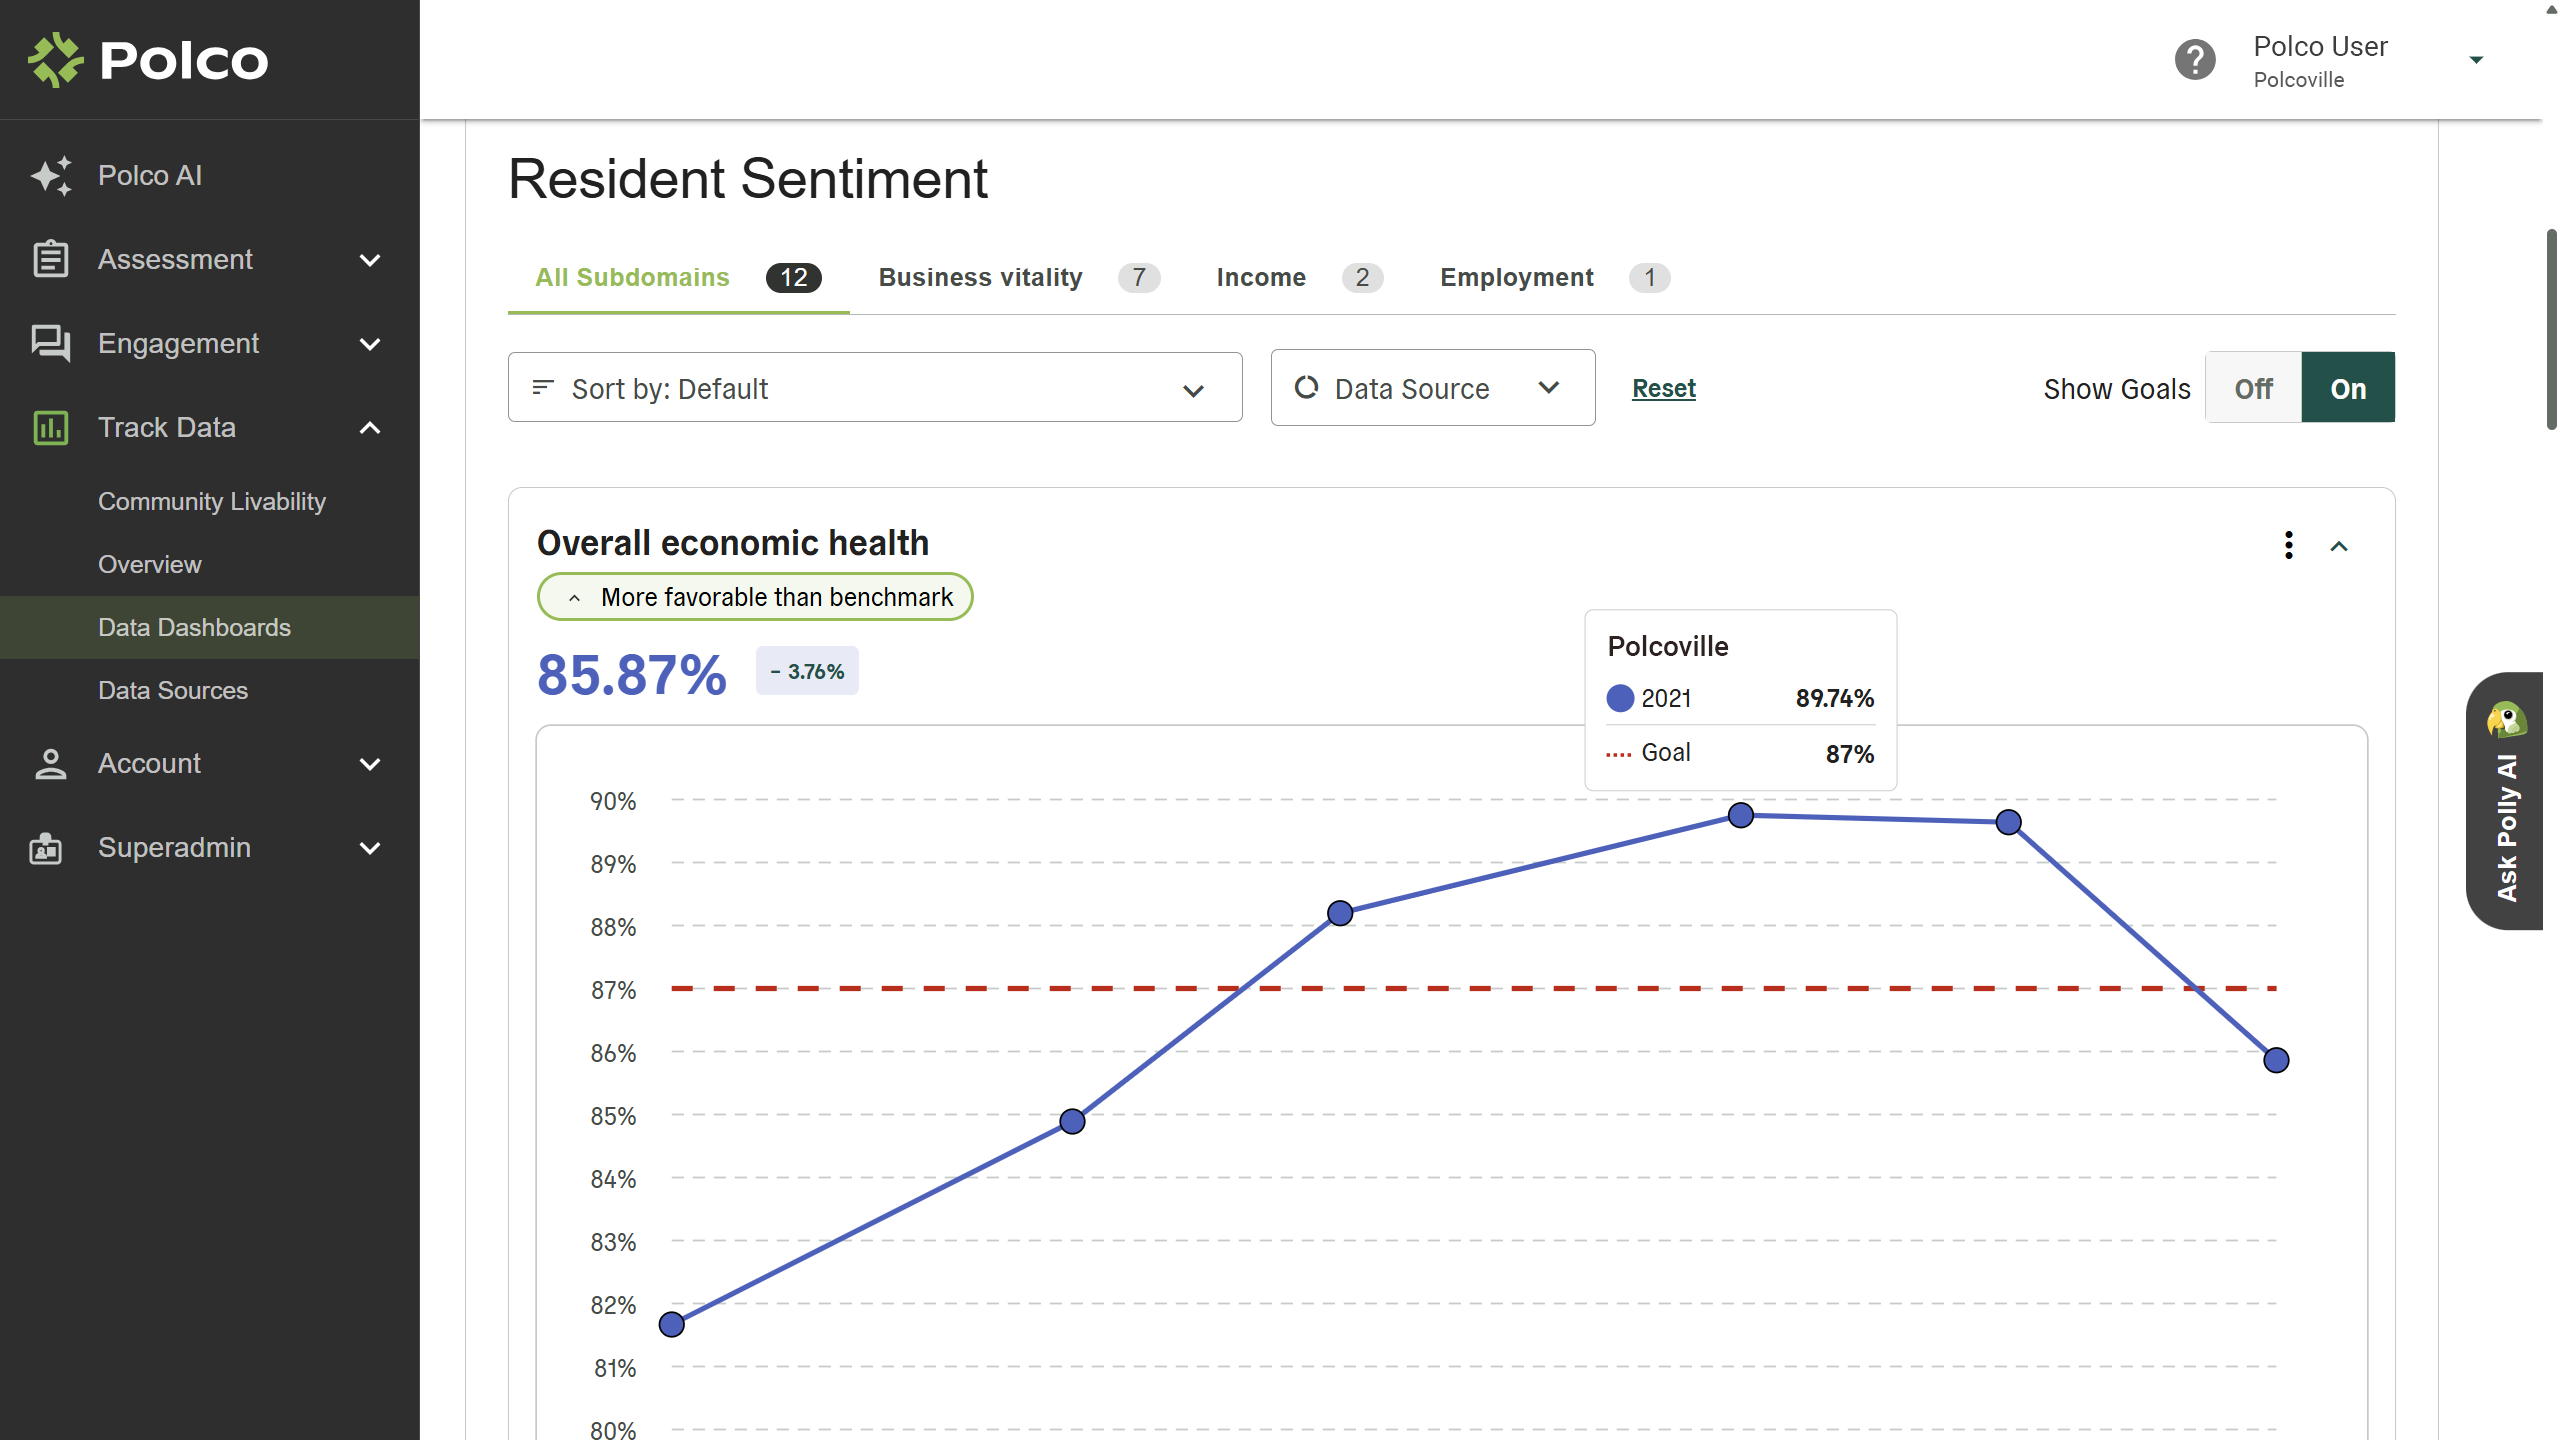
Fueled by GPAL, Polco’s advanced data tools enable us to dig deep into multiple facets of community livability for any jurisdiction. We can analyze and compare critical data points on topics like housing density, crime rates, walkability, and public health across cities.
With Polco Track, we’re able to observe trends over time, while GPAL provides benchmarks and performance insights on a national scale. In this case, we used these powerful data tools to provide examples of communities that shine when it comes to safe trick-or-treating.
Walkability vs. Dental Visits:
We looked at walkability and dental care because walking from house to house can mean more candy stops and responsible dental care may indicate a health-conscious community. The "Healthy Haunts" quadrant features cities that balance good walkability with higher rates of dental visits—a fun insight that also hints at a safe and healthy community.

Housing Density vs. Crime Rates:
We also compared housing density (how close homes are to each other) with violent crime rates. Cities in the "Safe but Spread Out" zone might mean a little more walking between houses, but they’re perfect for families focused on safety. On the other hand, the “Candy Kingdom” cities (those with high density and low crime) offer an ideal trick-or-treating setup, with lots of homes close together and minimal safety concerns.

Connecting Halloween and Broader Community Planning
Data comparisons like these remind us how community planning and local government decisions impact even the sweetest of traditions, like trick-or-treating. Cities that prioritize walkability, safety, and overall health create environments where families can have fun while staying protected. These insights go beyond Halloween. The same factors that make a place great for trick-or-treating are also vital to creating a thriving, resilient city year-round.
By analyzing public data, local governments can better understand their communities and meaningfully address residents' needs. So, wherever families are trick-or-treating this year, we hope this information can help you plan and host safe and engaging community events.
Take Strategic Planning to the Next Level This Halloween Season
Ready to transform your community with data-driven insights? Discover how easy access to public data and benchmark scores can elevate your strategic planning. Polco’s platform offers free resources tailored for local government leaders—just in time to make an impact. Don’t miss out on these powerful tools—sign up today to get started!
Related Articles
Track Is Not Just a Dashboard. It’s a Decision Engine.

Beyond the Snowbird: How Boomers are Shaping the Future of Retirement