

By Polco on May 29, 2026
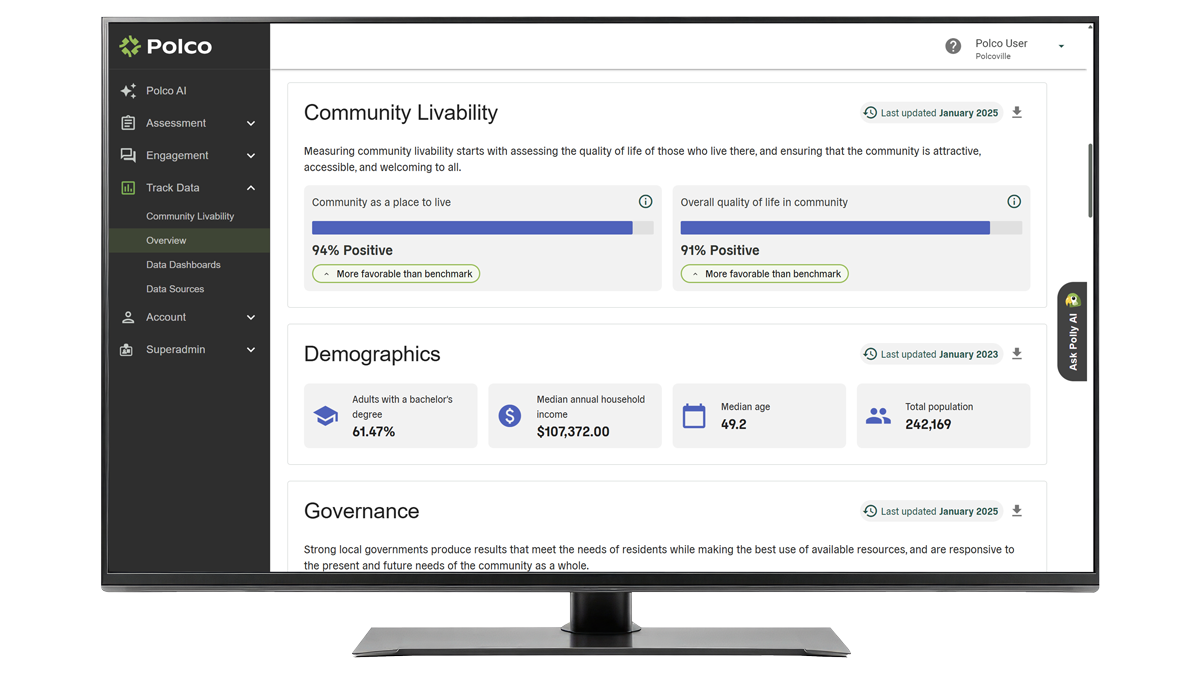
Most department heads don't suffer from a lack of data. They suffer from a lack of clarity.
Today's local government leaders have access to more dashboards, reports, scorecards, and spreadsheets than ever before. Yet many still face the same challenge when it comes time to make a decision: What deserves attention right now?
Visibility is valuable. But visibility alone doesn't improve services, allocate resources, or solve community problems. The most effective leaders focus on data that helps them prioritize, act, and communicate with confidence.
The difference between a useful dashboard and a decision-making tool comes down to one question: Does the data tell you what to do next?
The Dashboard Trap
Many organizations build dashboards that track everything: Website visits, service requests, program participation, budget expenditures, employee metrics, performance indicators, and more.
While these measures provide visibility, they often fail to answer the questions department heads ask every day:
- Which issues require immediate action?
- Where should we focus limited resources?
- What outcomes matter most to residents?
- Are we improving compared to similar communities?
-
Which investments are producing results?
Without context, data becomes noise. A dashboard full of numbers may look impressive, but if leaders cannot connect those numbers to priorities and outcomes, decision-making remains reactive.
The Five Types of Data That Drive Better Decisions
The most valuable operational data typically falls into five categories.
1. Trend Data: Are We Improving or Declining?
A single data point rarely tells a meaningful story. Trend data reveals direction. For example:
- Is response time improving over the last 12 months?
- Are resident satisfaction scores increasing or declining?
- Has program participation changed significantly since last year?
Trend analysis helps leaders identify emerging problems before they become crises and recognize successful initiatives before they go unnoticed. Instead of asking, Where are we today? effective leaders ask: Where are we heading?
2. Benchmark Data: How Do We Compare?
Context matters. A parks director may see a 72% satisfaction rating and wonder whether that's good or bad. A public works director may celebrate a performance metric without knowing peers achieve substantially better results. Benchmarking transforms isolated numbers into actionable insights by comparing performance against:
- Similar-sized communities
- Regional peers
- National averages
- Historical organizational performance
Benchmark data creates perspective. It helps leaders distinguish between perceived problems and actual performance gaps. When departments understand where they stand relative to peers, prioritization becomes significantly easier.
Benchmark surveys are particularly valuable because they provide statistically valid comparisons across critical areas of community livability and government performance.
3. Resident Feedback: What Matters Most to the People We Serve?
Operational metrics tell leaders what is happening. Resident feedback helps explain why it matters. A department may hit every internal performance target while residents remain dissatisfied with the overall experience. Conversely, a department may be focusing resources on issues that residents do not consider priorities.
The strongest decisions combine operational data with community sentiment. When leaders understand both performance metrics and public priorities, they can align resources more effectively and communicate decisions more confidently.
Organizations that consistently gather representative resident feedback gain an important advantage: they can focus on what matters most, rather than what generates the most noise.
4. Outcome Data: Did the Investment Create Results?
Many dashboards measure activity. Great leaders measure outcomes. Activity metrics include:
- Number of projects completed
- Number of inspections conducted
- Number of meetings held
Outcome metrics answer a different question: Did those activities improve community conditions? For example:
- Did safety perceptions improve?
- Did mobility become easier?
- Did park usage increase?
- Did economic opportunities expand?
Outcome-focused data connects daily operations to broader community goals. This shift helps department heads move from reporting effort to demonstrating impact.
5. Predictive Data: What Happens If We Do Nothing?
The most powerful data is often forward-looking. Predictive analytics can help leaders understand:
- Future service demand
- Population shifts
- Budget pressures
- Workforce needs
- Economic trends
Rather than reacting to problems after they occur, predictive insights allow departments to prepare proactively. When leaders can anticipate future conditions, they make stronger investment decisions today.
Building a Decision-Centered Data Strategy
The best-performing organizations don't collect data for reporting purposes alone. They build systems that connect:
- Operational performance
- Community priorities
- Benchmark comparisons
- Strategic goals
- Future forecasts
This creates a decision-making framework rather than a reporting framework. When data is organized around decisions, department heads spend less time searching for answers and more time solving problems.
The Questions Every Dashboard Should Answer
Before adding another chart or metric, ask:
- What decision will this information support?
- What action should someone take if this number changes?
- Does this metric connect to a strategic goal?
- Does it include community context or resident priorities?
- Can leaders compare performance against peers or benchmarks?
If the answer is no, the metric may be interesting, but it may not be useful.
From Information to Action
The goal of data is not awareness. The goal is action. Department heads need information that helps them allocate resources, prioritize initiatives, explain decisions, and improve outcomes.
That means moving beyond dashboards filled with disconnected metrics and focusing instead on the data that creates clarity:
- Trends that reveal direction.
- Benchmarks that provide context.
- Resident feedback that identifies priorities.
- Outcomes that demonstrate impact.
- Predictive insights that support planning.
When leaders have access to the right data, they spend less time asking what happened and more time deciding what comes next. And that's where better decisions begin.
Ready to move beyond dashboards and toward better decisions?
Polco helps local government leaders combine operational metrics, benchmark comparisons, resident feedback, and predictive analytics into a clearer picture of community needs and organizational performance. The result is greater confidence in prioritization, planning, and resource allocation.
If you're looking for a better way to turn information into action, request a demo and see how Polco can help your team focus on what matters most.

How Community Engagement Helps Leaders Make Tough City Budget Decisions
How Polco’s New Track Feature Puts Older Adults’ Data in Focus