By Polco on March 13, 2026

Collecting resident feedback is only part of the work. The next challenge is understanding what the results actually mean.
A statistically reliable survey is valuable not just because of how it gathers data, but because of how that data is interpreted. Without the right context, leaders can overreact to small differences, combine unlike response types, or mistake participation volume for true representativeness.
Margin of error is not just a technical detail
When people hear that a survey has a margin of error, they may assume it is a small footnote. In reality, it is one of the clearest signs that survey results are being presented responsibly.
Margin of error reflects sampling variability. It shows how much the reported results could reasonably vary due to the fact that the survey measured a sample rather than the entire population.
That does not make the results unreliable. It makes the interpretation more honest.
For example, if 58 percent of residents report positive feelings about a service and the margin of error is plus or minus 4 percent, the true value in the broader population is likely somewhat above or below that number. That context helps leaders avoid overreading slight shifts or narrow differences.
In general, larger and well-designed samples produce smaller margins of error, which means more precision.
Open participation has value, but it serves a different purpose
One of the most common mistakes in public engagement is treating all responses as if they carry the same methodological meaning.
Open participation can be incredibly valuable. It can broaden engagement, surface new ideas, highlight concerns, and bring in voices that might not appear in a sampled survey alone.
But open participation is not the same as a probability-based sample.
When anyone can opt in, the results reflect the people who chose to participate. That feedback can be useful and important, but it is not automatically statistically representative of the full community.
That is why the strongest survey approaches keep these two inputs separate. Probability-based responses form the representative dataset. Open participation responses add another layer of voice, context, and perspective.
This approach allows communities to respect broad participation without compromising scientific validity.
What leaders should look for in a reliable survey
If you are evaluating a survey partner or planning a community survey internally, a few questions can quickly reveal whether the process is likely to produce dependable results:
- Was the survey based on a probability sample?
- Was the sample drawn from a credible and complete household list?
- Were steps taken to improve representation among harder-to-reach groups?
- Are results reported with margin of error and clear methodological context?
- Are open participation responses kept separate from the statistically valid sample?
- Were accessibility measures included to support broader participation?
If the answer to those questions is yes, the results are much more likely to support confident decision-making.
How Polco helps communities build trustworthy survey results
Reliable community data does not happen by chance. It comes from a survey process designed to reach the right households, reduce bias, and produce results leaders can stand behind.
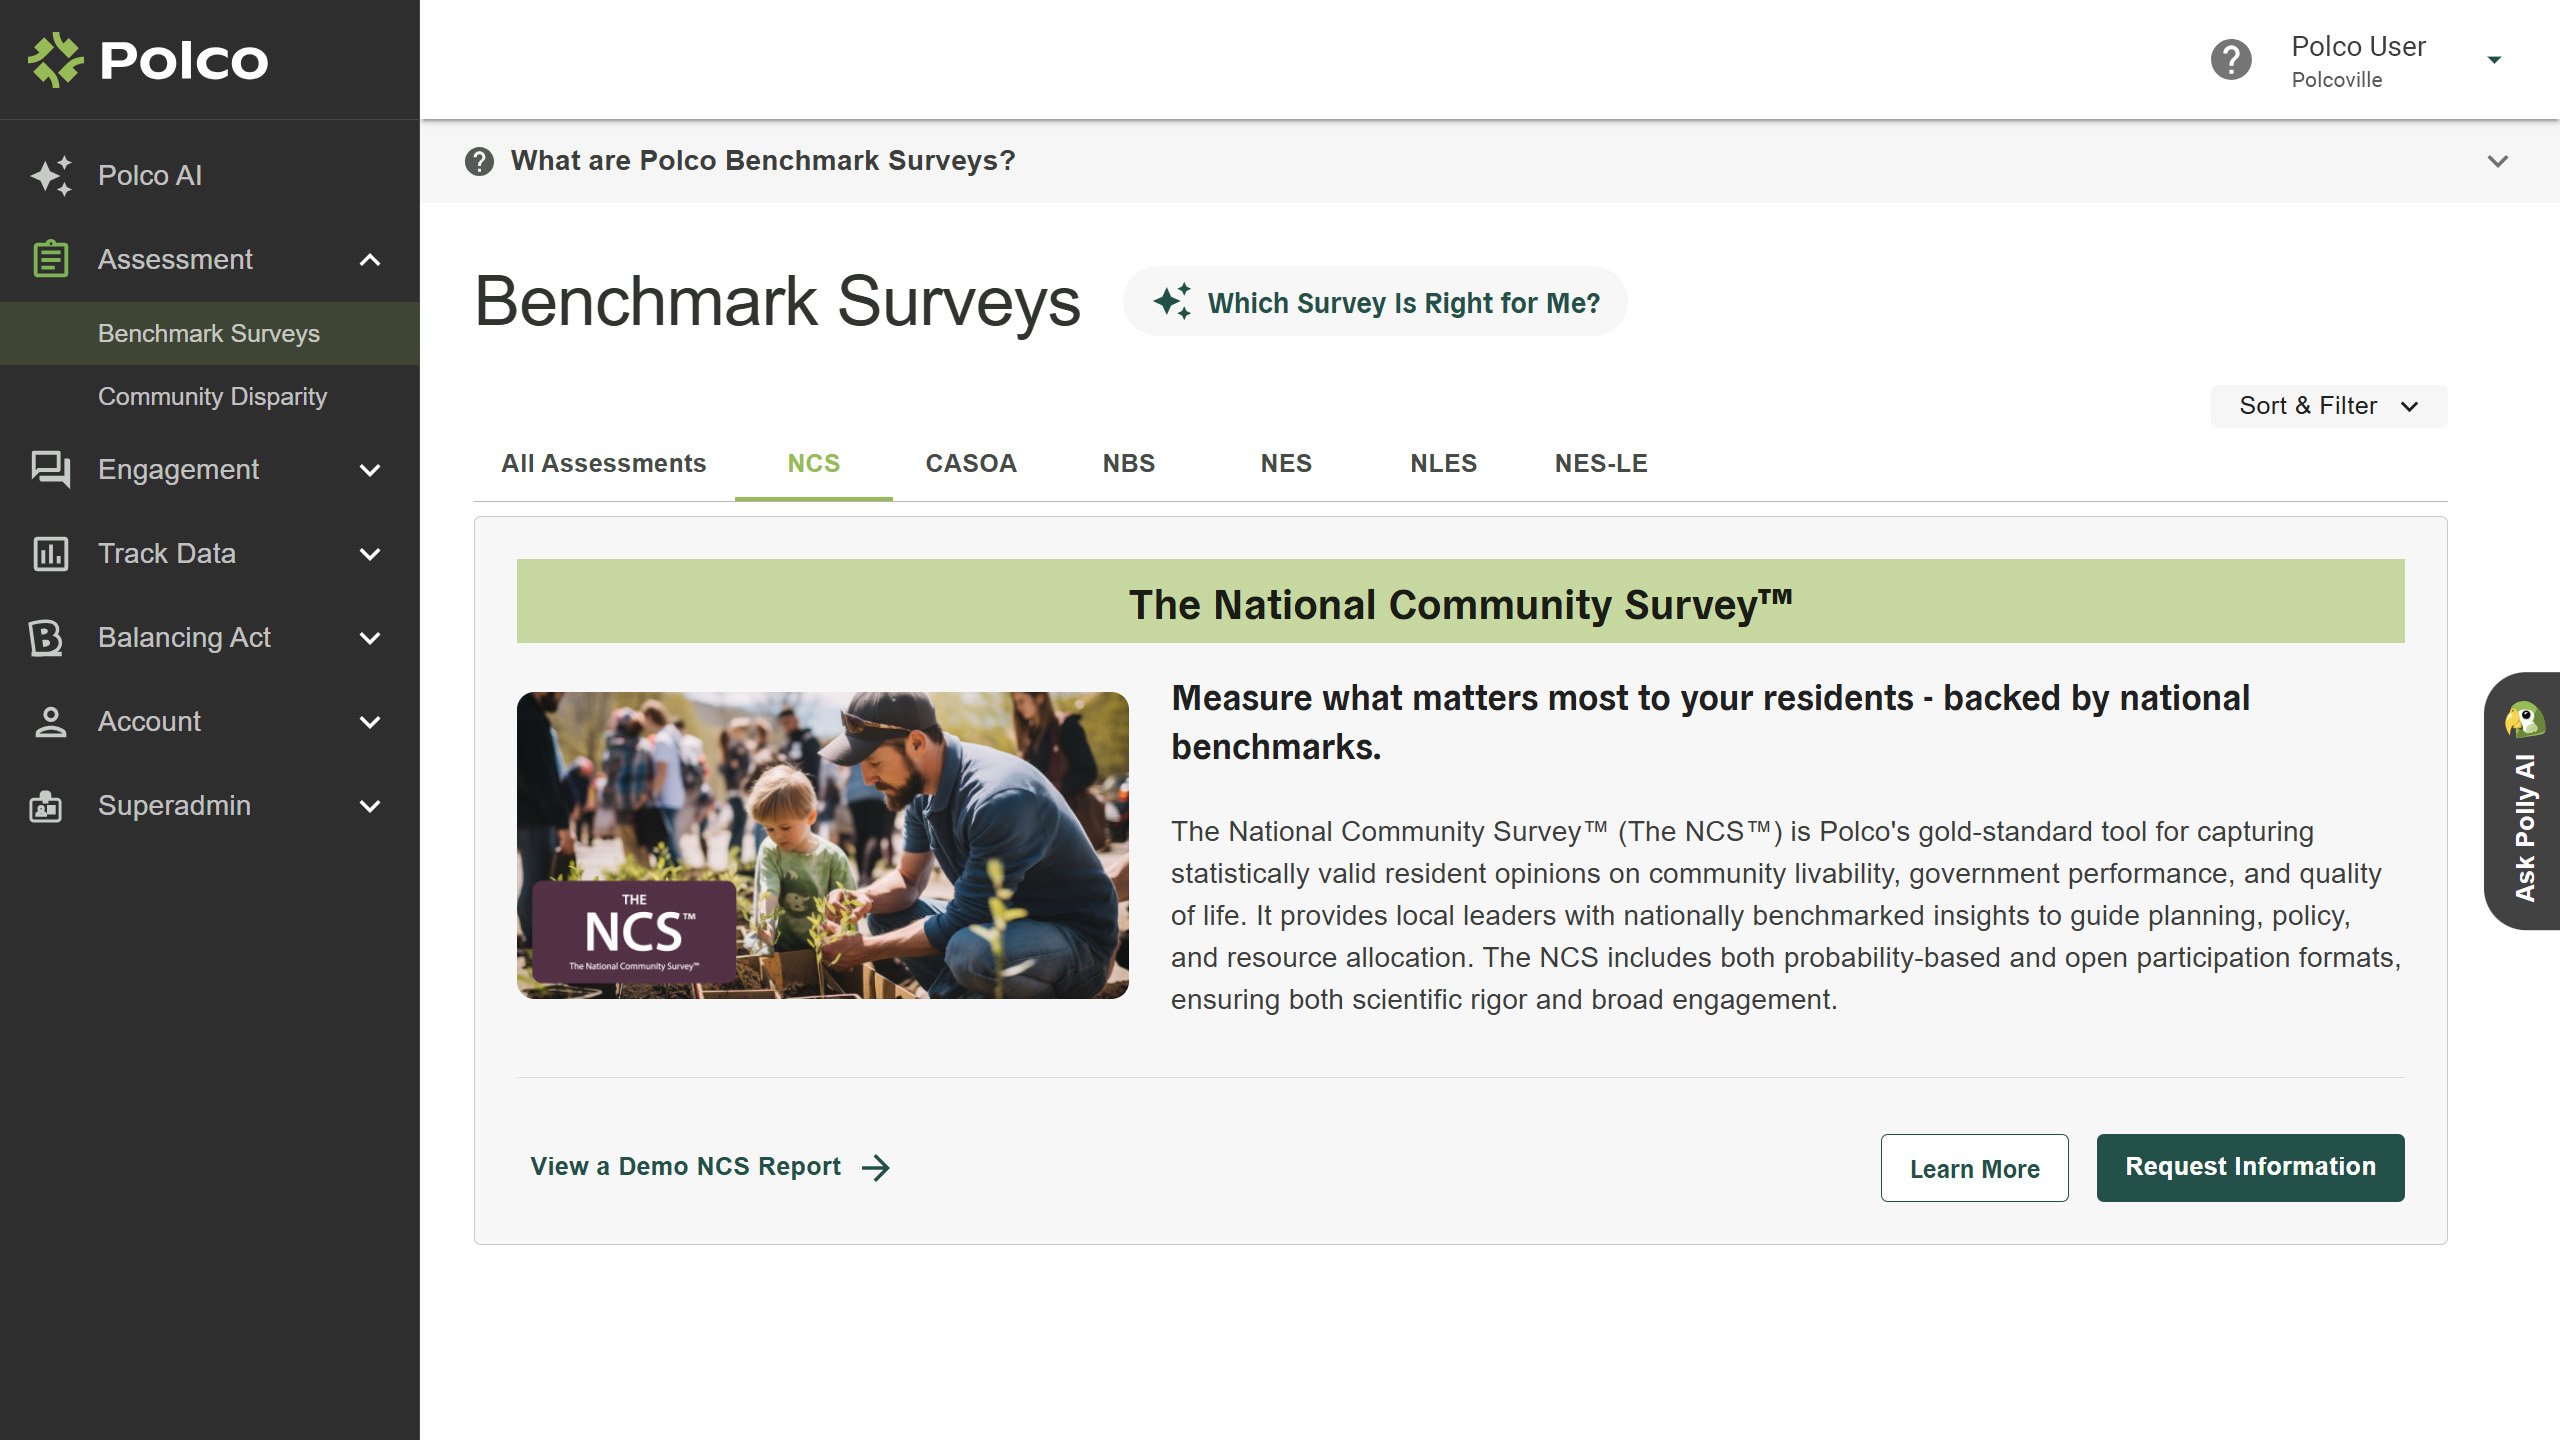
That is where Polco Benchmark Surveys can help. Polco combines probability-based sampling, demographic weighting, multilingual access, and trusted national benchmarking to help local governments gather resident feedback that is both statistically reliable and practical for decision-making.
For communities that want more than anecdotal input, Benchmark Surveys offer a clearer, more credible view of resident priorities, satisfaction, and needs.
Learn how Polco Benchmark Surveys can help your community measure what matters and make decisions with confidence.


Why Community Input and Priority Based Budgeting Go Together, Perfectly
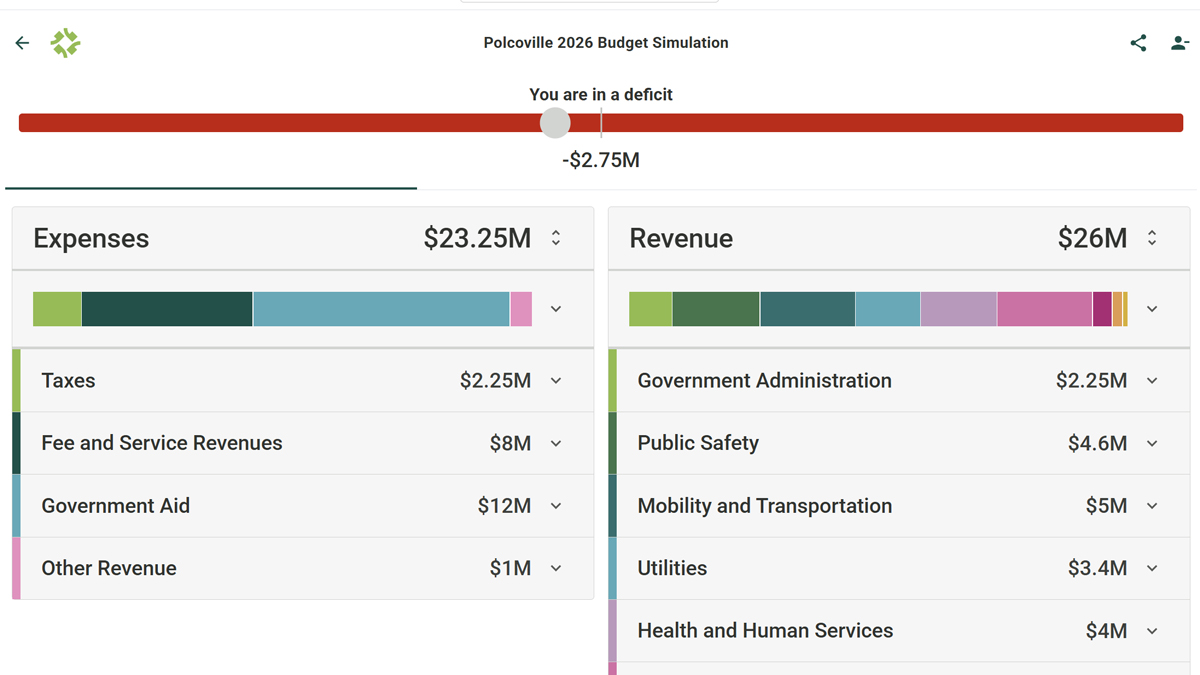
The Real Cost of a Budget Nobody Understood