By Polco on November 6, 2020

- By Michelle Kobayashi -
A new study by National Research Center at Polco provides a rare and insightful look at equity and inclusion in US communities, according to the residents.
Along almost any definition of “diversity,” the United States has become more and more diverse over the last couple decades. And with it, cities are grappling with questions about equity and inclusion. They are asking themselves if there are systemic biases they may not have been aware of previously. Local governments are looking to understand if residents feel welcome, if diversity is an organizational value, and if community-members think their government is just.
“Community populations continue to evolve to include new and diverse members. So it is essential to support city leaders with the tools and resources necessary to help understand the needs, expectations, and priorities of all residents, businesses, and stakeholders,” said Matt Fulton, Vice President of National Engagement at Polco.
Community Equity and Inclusion Survey
National Research Center (NRC) at Polco recently created a new survey on equity and inclusion. This survey helps jurisdictions assess how residents perceive measures of social cohesion and belonging in their communities.
The goal of the Community Equity and Inclusion Survey is to get a sense of a community’s strengths and areas for improvement related to promoting a sense of welcoming for all. This helps a local government better understand their current state and track progress.
“We need to understand where we are now before we can be sure we are being successful in making headway,” said Waunakee, Wisconsin Village Administrator Todd Schmidt.
Waunakee used the Community Equity and Inclusion Survey to better understand their baseline. They plan to periodically administer the survey to monitor the impact of their efforts.
“Our goal is to see permanent movement on the needle in terms of perceptions in the community,” added Schmidt.
National Results from the Community Equity and Inclusion Survey
In the summer of 2020, NRC conducted our own national study of Community Equity and Inclusion. We surveyed a nationwide sample of US residents, and analyzed data from ten other communities that also conducted the same survey.
We received more than 3,000 responses, and after statistical analyses, we can derive a baseline for inclusivity within the nation. (Data were statistically weighted to represent the population of the United States to the best extent possible. However, results may still over-represent communities and residents who place a higher priority on community equity and inclusion.)
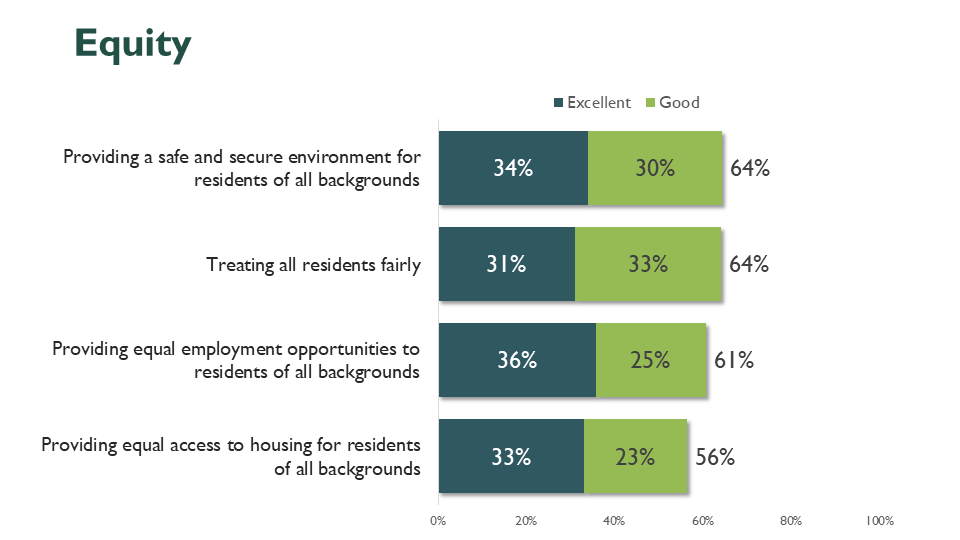
In terms of inclusivity, equity, and diversity, survey results demonstrate that most residents give positive ratings for their communities. But there is still room for growth. About six in ten residents reported favorable results for most of the measures assessed.
Measures of Community Inclusivity

Measures of Community Equity
Comparing Results by Respondent Background
We also compared the results by respondent background. This reveals whether characteristics such as age, gender, race or income are associated with feelings of community inclusivity.
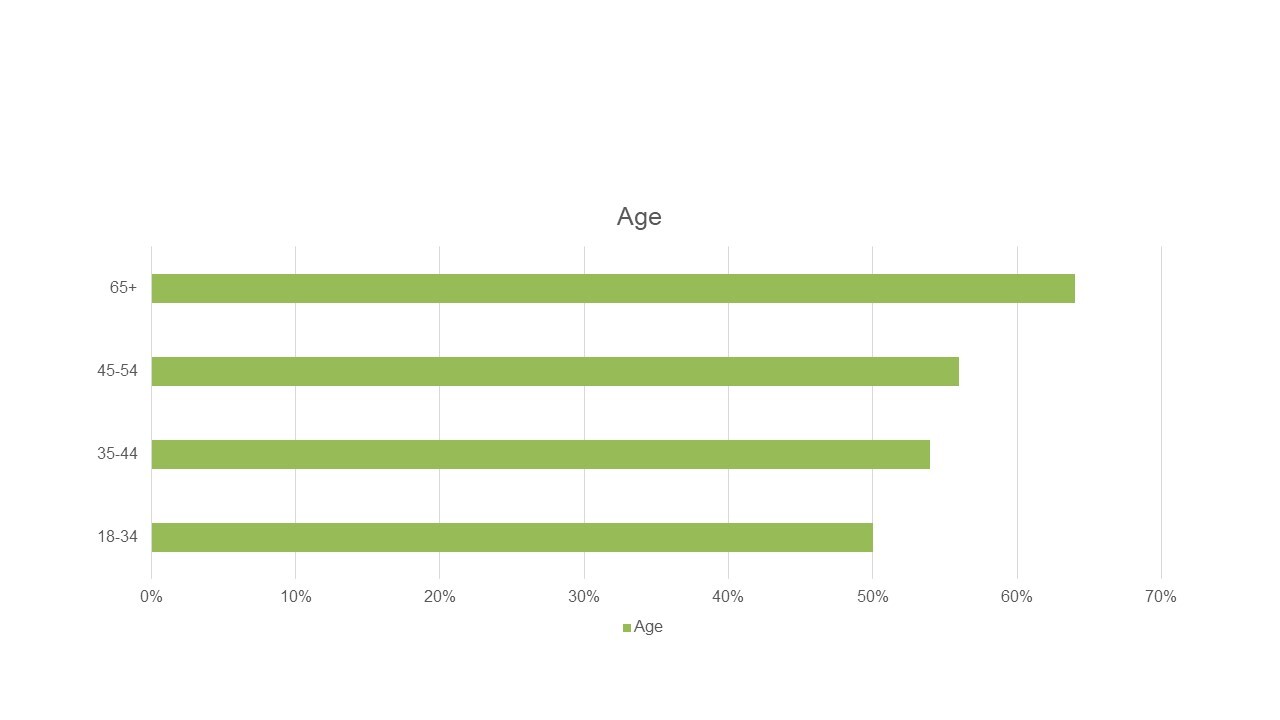
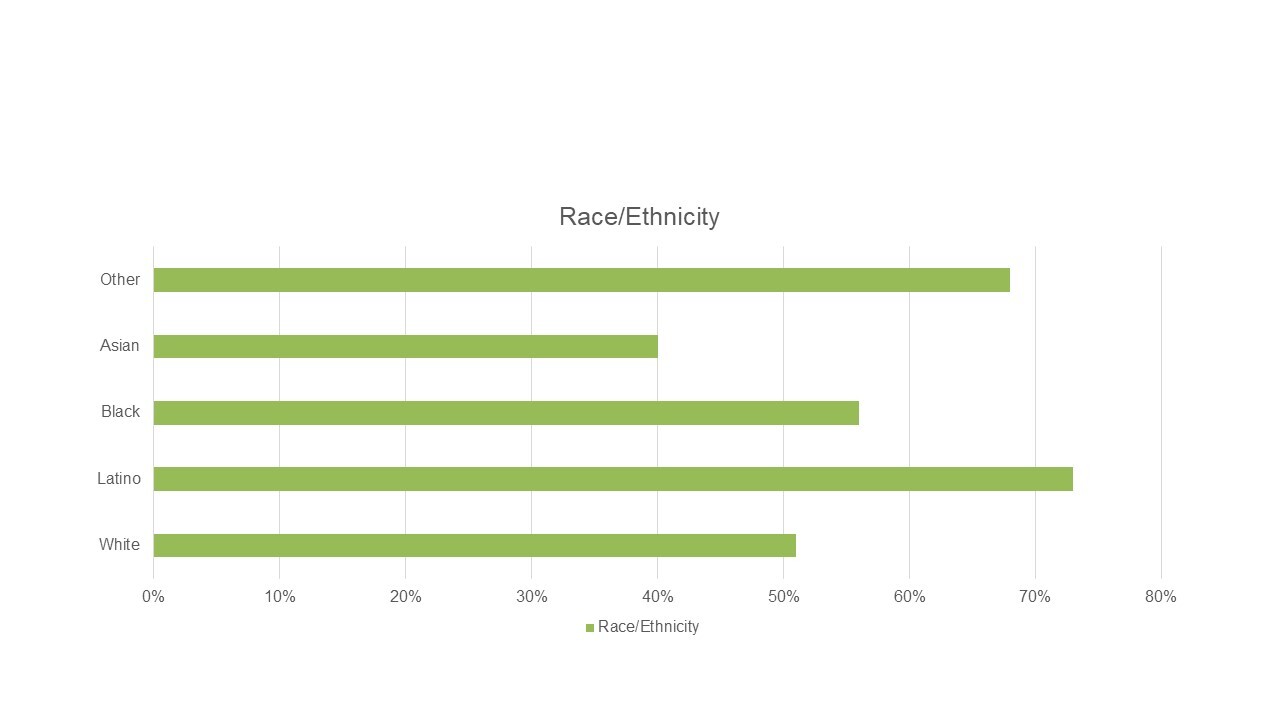
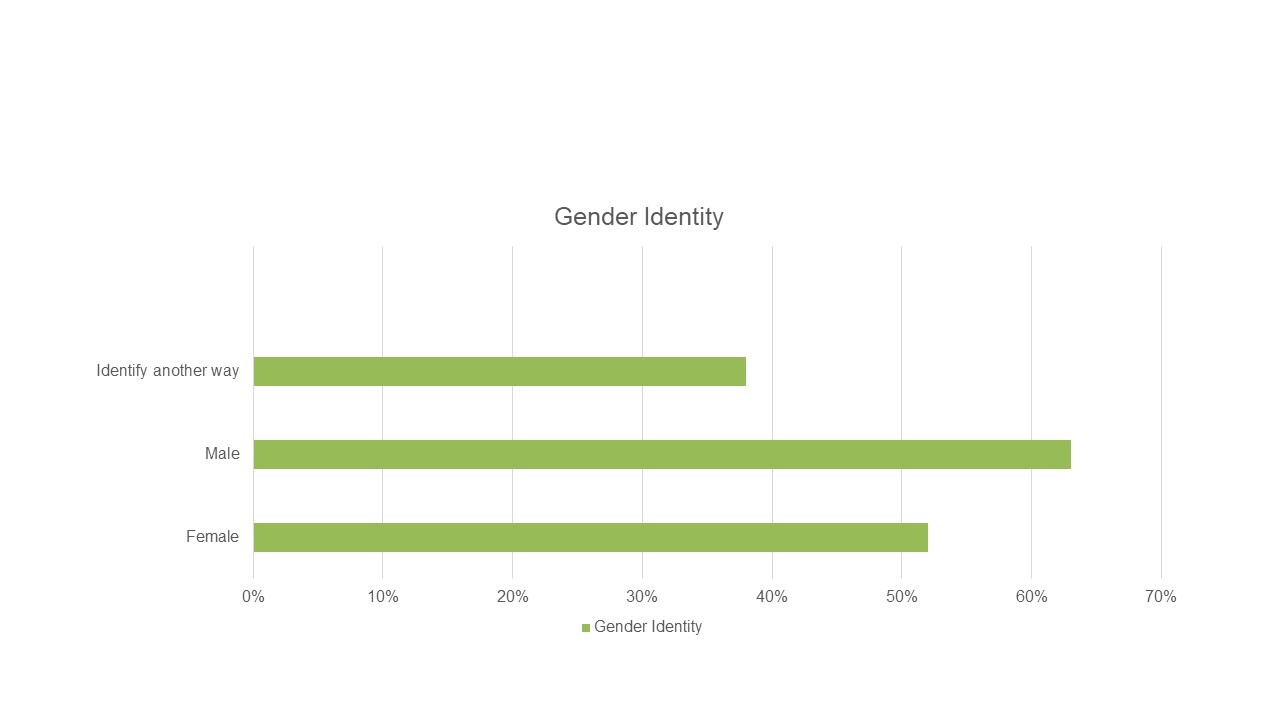
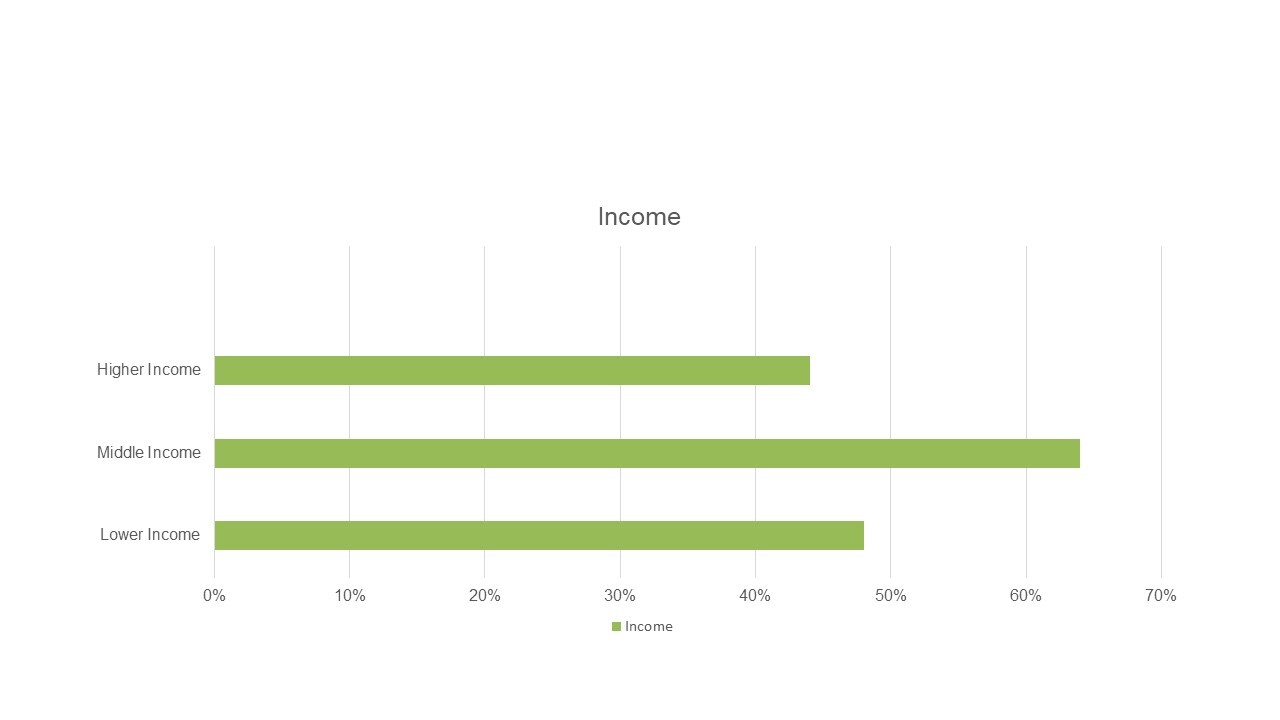
We find that older people, males, Latinos, and middle income people tend to have more positive ratings for how their community values residents from diverse backgrounds.
Community Values Residents From Diverse Backgrounds: Percent Rating Excellent or Good by Age
Community Values Residents from Diverse Backgrounds: Percent Rating Excellent or Good by Race/Ethnicity
Community Values Residents from Diverse Backgrounds: Percent Rating Excellent or Good by Gender Identity
Community Values Residents from Diverse Backgrounds: Percent Rating Excellent or Good by Income
How Equity and Inclusion Data Help Community Leaders
By understanding how different groups view equity and inclusion, community leaders can develop more targeted plans and efforts to support a sense of welcoming for all.
“Equity and inclusion work is just the right thing to do. It’s more than important. It’s human. It’s humane. And, it’s essential to good government,” said Schmidt.
The Community Equity and Inclusivity (CEI) Survey is available in the Polco Library. Local governments across the nation can publish and administer this survey in their own communities for free. LEARN MORE
Related Articles
- Diverse Resident Voices Empowered through New Community Equity and Inclusion Survey
- What Local Government Leaders Should Know about Equity and Inclusion According To Residents
- How Decatur Empowers Residents To Be Leaders in Shaping Their Community
Allowing Repeat Responses

Introducing Polco Live — Get Instant Resident Engagement