By Polco on May 6, 2025
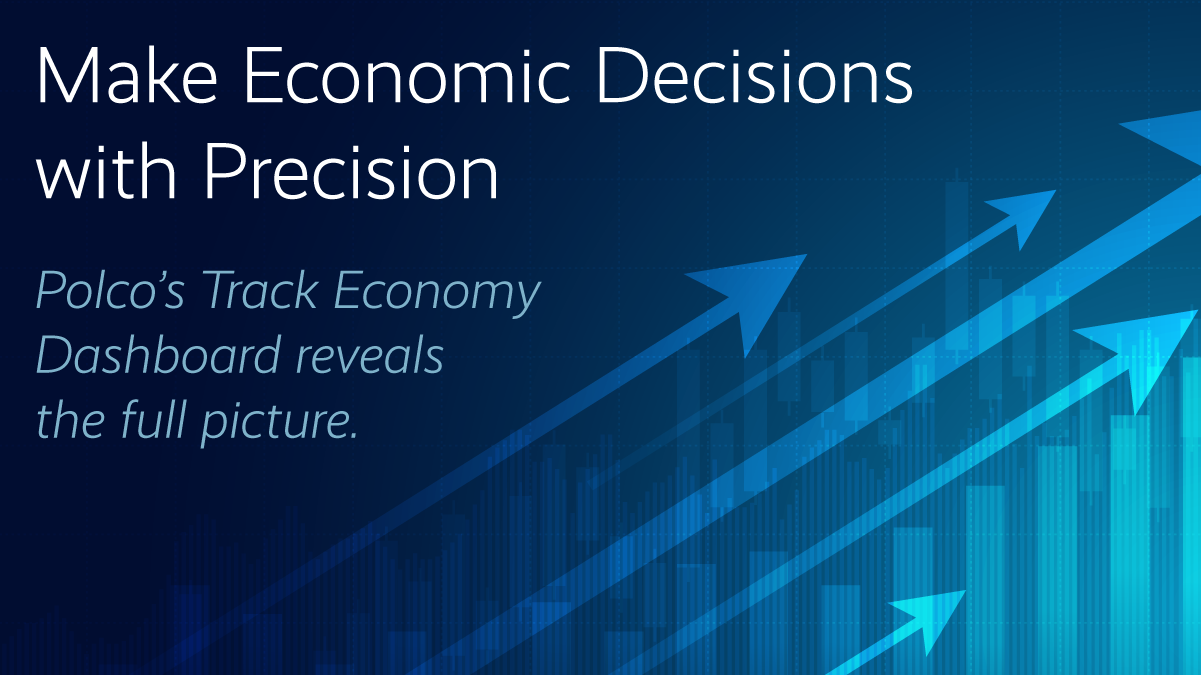
How Polco’s Track Economy Dashboard Helps Local Governments Plan Smarter
You can’t solve what you can’t see. In local government, understanding your community’s economy is essential to making informed decisions. Yet economic conditions are often complex, ever-changing, and difficult to measure, until now.
Polco’s Track Economy Dashboard gives city and county leaders an all-in-one view of local economic health. It’s part of the Track module, Polco’s powerful civic analytics platform built specifically for public-sector decision-makers. With just a few clicks, you can access interactive data on the key economic indicators that matter most - like jobs, income, business vitality, poverty, and economic resilience.
From Data to Economic Intelligence
The Economy dashboard is more than a collection of statistics. It’s a dynamic view of how your local economy is performing - powered by trusted national sources like the U.S. Census, Bureau of Labor Statistics, and the Bureau of Economic Analysis.
Each indicator is visualized with:
- National benchmarks for context
- Peer comparisons to similar communities
- Historical trends that reveal movement over time

Whether you’re evaluating wage equity or identifying disparities in poverty rates, the dashboard translates raw data into actionable insight.
✅ Analyze how your job market compares to the national average
✅ Measure income inequality and household wage growth
✅ Explore conditions for older adults and economically vulnerable groups
✅ Pinpoint strengths and gaps in business resilience
✅ Save key metrics and build shareable, insight-driven goals
Turn Charts into Change
A standout feature of the dashboard is its interactive histogram visualization. Your community is the bold blue bar, making it easy to see exactly where you stand in relation to your peers.
It’s more than a chart. It’s a spark for strategy.

Pair it with built-in predictive analytics and Polco’s Goal Tracker feature, and you’ve got a roadmap for economic development, grant proposals, and strategic budgeting.
Why Economic Intelligence Matters Now
Far too often, economic planning is reactive. Leaders wait for problems to emerge before acting. But with Polco’s Track Economy Dashboard, you can get ahead of the curve, spotting challenges early and shaping policies before issues escalate.
Economic trends influence everything, from job creation to tax revenue to housing affordability. The faster you can identify shifts, the more effectively you can respond.
Drive Smarter Growth with Trusted Data
With Polco, you're not guessing. You're leading with facts.
The Track Economy Dashboard gives you:
- A comprehensive, up-to-date snapshot of your local economy
- Easy-to-understand visuals that clarify trends and comparisons
- Peer benchmarking that reveals where you shine, and where you need support
- Goal-setting tools to align data with strategic planning
Ready to Lead with Data?
Local economic planning doesn't have to be complicated. With the right tools, it becomes intuitive and impactful.
Start making smarter decisions for your community
👉 Explore the Track Economy Dashboard >>

New Polco Survey Helps Leaders Assess COVID-19 Economic Impacts