Where Workouts Work Out: Best and Worst Regions in the U.S. for Health and Wellness Opportunities
By NRC on January 15, 2016

- By Tom Miller -
I’ve got retired friends whose new work is to work out. It’s full time! They take fitness classes at the Y, hike, golf, ski, play tennis, swim, bicycle. Some nuts still play league football and technical climb. Staying healthy, especially as the population ages, not only works the body, it focuses the mind. Our ability to get and remain well at any age determines not only how we live but where. Like the migration West to clean air for Easterners diagnosed with tuberculosis or asthma in the twentieth century, what Americans today think about their opportunities to remain healthy influence where they choose to live. So cities and counties must offer activities that support wellness.
Data reported in this video come from The National Citizen Survey™.
It’s not enough to count the number of recreation centers or miles of paths to know if the population is happy with the level of health and wellness resources in their community. If you ask residents, they will let you know what they think. In our survey research, we have asked people from all parts of the U.S. to rate their community’s health and wellness opportunities. Ratings comprise a variety of community characteristics like fitness opportunities, availability of paths and trails, recreational activities, recreation centers and public parks.
Most Americans think well of their opportunities for health and wellness.
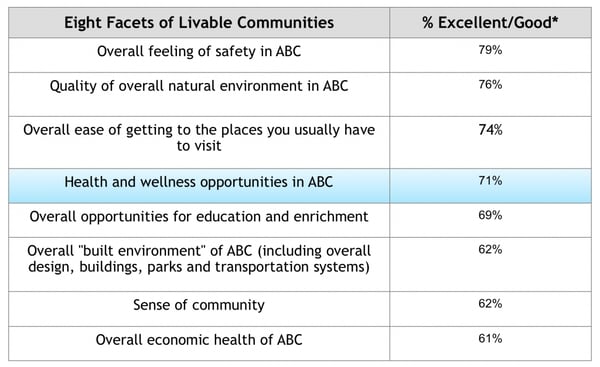
Table 1: Rating of Health and Wellness Among Eight Central Facets of American Communities
Of eight key facets of community life, ratings of the quality of health and wellness opportunities fall to the middle: below feeling safe, quality of the natural environment, ease of getting to places you need to visit and above opportunities for education and enrichment, the built environment, sense of community and the economy.
In the U.S. overall, health and wellness and fitness opportunities rate highly.
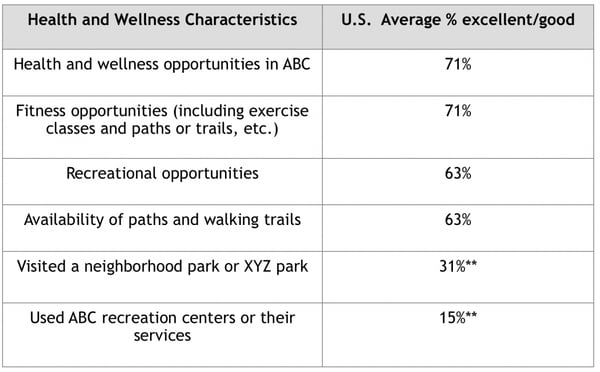
Table 2: Ratings of Health and Wellness Indicators Across U.S.
In Table 2 you can see that Americans rate health, wellness and fitness opportunities higher than other wellness characteristics. Lower ratings of quality are given to recreational opportunities or availability of paths and walking trails. Relatively small numbers of Americans report visiting city recreation centers or public parks even twice a month.
Both ratings and activity levels vary depending on where in the country folks live.
A national index of health and wellness ratings shows that some parts of the country are doing better than others according to the perspectives of residents themselves.
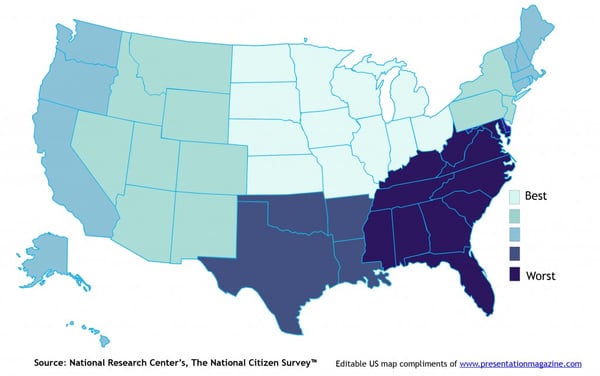
Best and Worst Regions for Health and Wellness Opportunities
Data depicted in this map show residents’ perspectives regarding health and wellness opportunities provided to them by the communities in which they live, and does not compare average physical health or lifestyles of citizens.
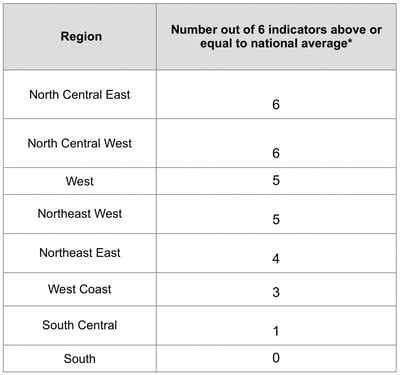
Table 3: Health and Wellness Index for Eight Regions of the U.S.
You can see in Table 3 and the associated U.S. map that overall health and wellness ratings by residents living in Southern states are lowest. (And it turns out that state surveys done by the Centers for Disease Control to measure physical activity of residents confirm that the most sedentary citizens live in the South and the South Central regions of the U.S.) Furthermore, surveys by National Research Center show that residents living in the North Central part of the U.S. reported generally higher than average ratings and usage of local health and wellness amenities provided by their community.
Since ratings on these factors vary in each community and because health and wellness is understood to be a driver of resident location and satisfaction, it is important that cities, towns, villages and counties understand how their residents feel about local wellness conditions. That knowledge is vital for planning and key to creating healthier, more desirable places to live.
Featured photograph and video by Angelica Wedell
Related Articles
Popular posts
Sign-up for Updates
You May Also Like
These Related Stories

Harnessing Workforce Opinion to Make Your Organization Stronger

How Does Survey Sampling Work?


